Listing Analytics & Performance
How to read the view, inquiry, and application metrics behind a listing to understand what’s working and what to change.
A listing that isn’t renting is telling you something — analytics help you figure out what.
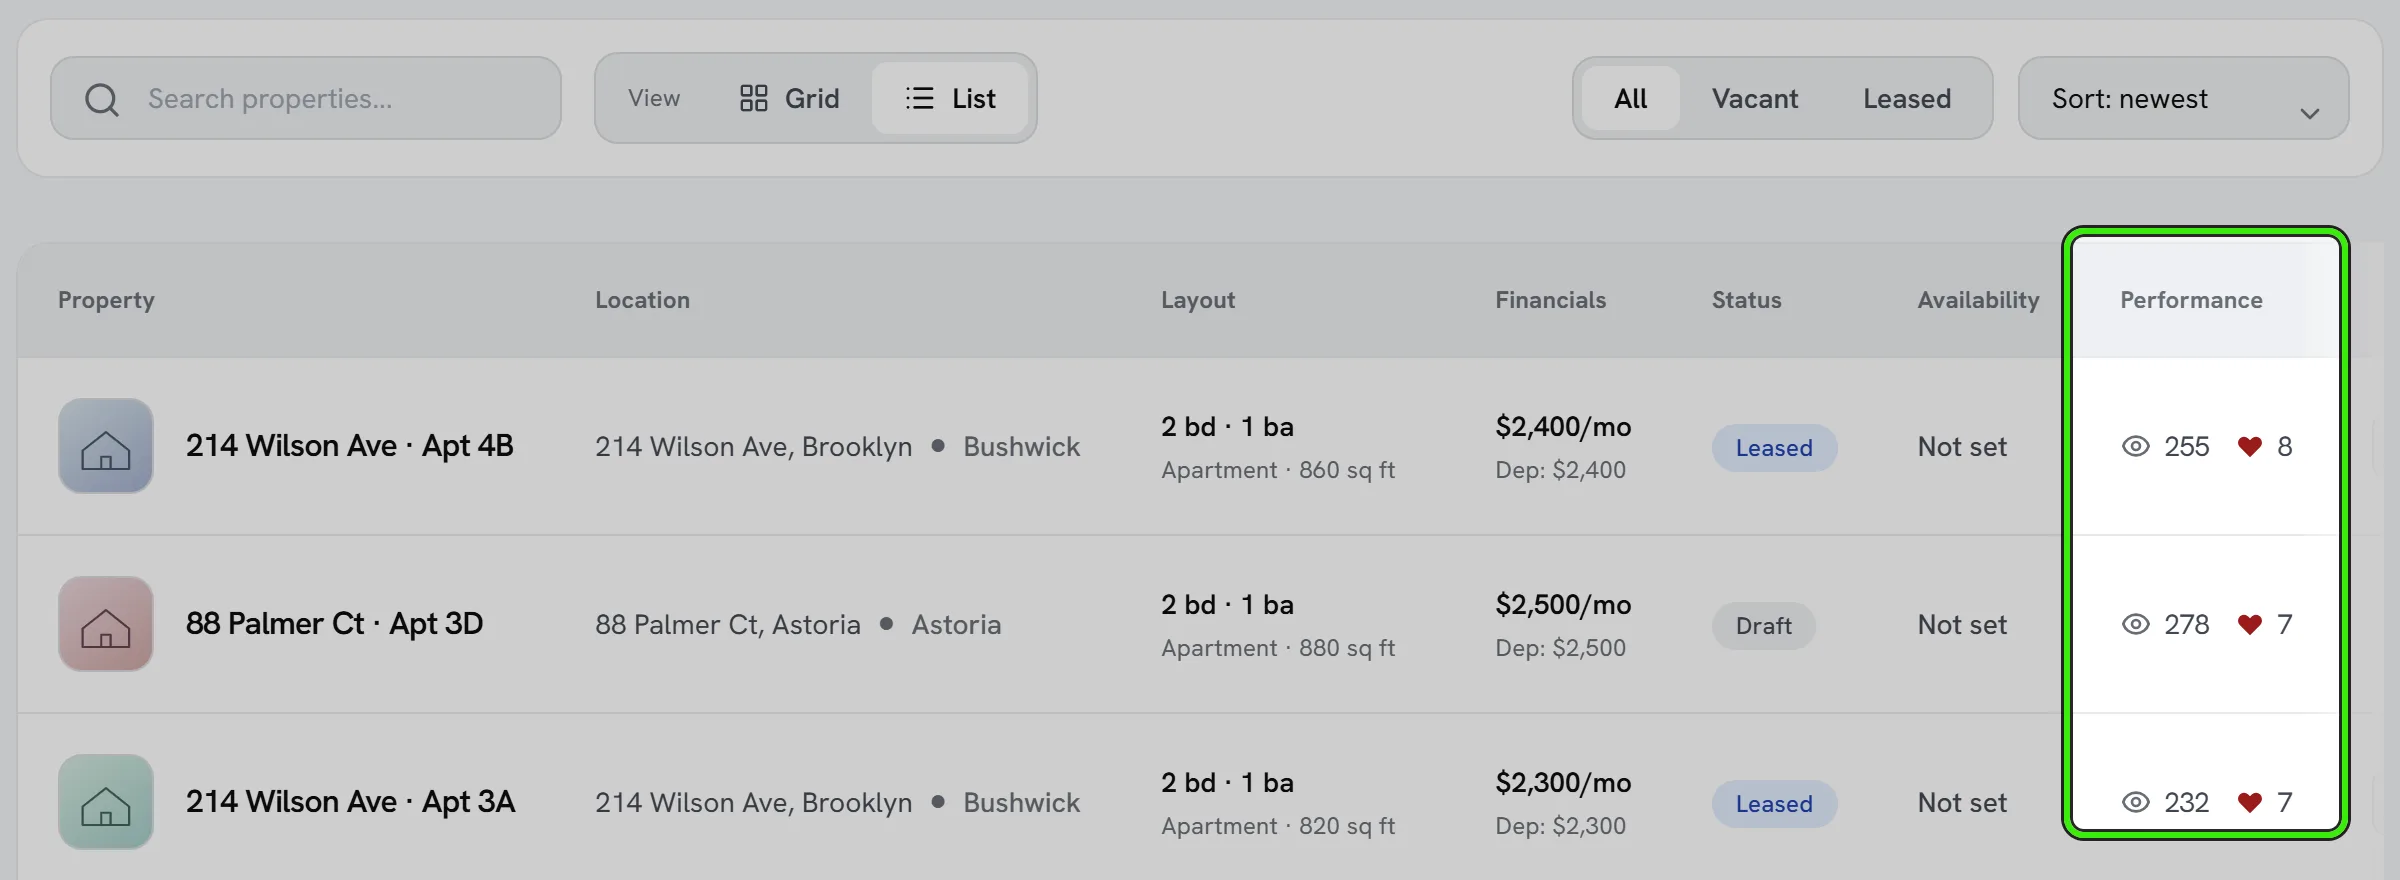
What you can see
- Views over time for a listing.
- Inquiries and applications generated.
- How a listing compares to similar ones nearby.
Diagnosing a slow listing
Low views usually point to price, photos, or visibility; views with few applications usually point to the description, missing details, or a slow response time to inquiries. Compare against the checklist in creating a listing to spot gaps.
Using data to price correctly
If a similar unit nearby rents quickly and yours doesn’t, price is often the first thing to reconsider. Analytics won’t make the decision for you, but they narrow down where the problem is.
Frequently asked questions
How often should I check listing analytics?
Weekly is usually enough for an active listing. If a listing has been up for a while with low views or applications, that’s the signal to look sooner and make a change.
Why does a similar listing nearby get more views?
Usually price, photo quality, or completeness of the listing details. Compare side by side against the checklist in creating a listing to spot the gap.
Can I see analytics for a listing that already rented?
Yes — historical listing performance stays available, which is useful for comparing how quickly different listings rented and what pricing worked.
Does a high view count guarantee applications?
No — views measure interest, not commitment. A listing with lots of views but few applications usually means something in the description, price, or photos is holding people back from applying.
Related guides
Related features and guides
- Creating & Publishing a Listing — Documentation. How to post a rental listing on Seayora — property details, pricing, availability, amenities, and how listings appear in search.
- Promoted & Featured Placement — Documentation. How listing ranking, featured placement, and promotion work on Seayora — and what is and isn’t guaranteed.
- Writing Compliant Listing Descriptions — Documentation. How to write listing copy that sells the unit while staying honest and fair-housing compliant.
- Listing Performance Analytics — Feature. Track views, saves, and applications per listing so you know whether a vacancy needs a better photo, a lower price, or more reach — instead of guessing.
- Portfolio Analytics & Dashboards — Feature. Customizable dashboards and portfolio reporting covering occupancy, vacancy, financial performance, and team metrics across every property you manage.
- Rental Listing Software — 60 Days Free, Then $9/Month — Feature. Advertise apartments, houses, condos, and townhomes for rent. Every listing gets its first 60 days free, then $9/month while the unit stays vacant — prorated daily and stopped the moment it rents. No brokerage fee, no setup fee, no subscription.